THE MONITORING PROCESS
(March 2023)
A troubled insurance
company’s fate can vary wildly. In most instances, an insurer remains viable
for many years. When change comes, it may more likely merge with another
insurer or be purchased by a larger company. The norm (and desired situation)
is that being placed into receivership is a rarity.
If things are
working properly, an insurance company’s performance is watched by, typically,
a given state’s insurance regulatory body. In the course of monitoring, an
insurer’s weakened position should be identified and corrected.
In general, the
process a state goes through with monitoring property and casualty insurers
involves the following:
- Collecting annual financial statements
from all insurers
- Examining the information and, using
some selection basis, running key information through a set of financial
tests
- Evaluating information on insurers with
financial statements that raise warning signals
- Performing audits on selected companies
- Depending upon audit results:
- Letting the company operate as usual (if audit results are positive)
- Creating a program of corrective action (typically requiring quarterly
or monthly, rather than annual, financial reports)
- Following up on corrective action
- If the situation deteriorates, considering more drastic action
- Placing company under conservatorship
- Attempting rehabilitation (if
conservatorship does not work or if rehab is selected instead)
- If rehabilitation fails, consider
finding the company insolvent
- If applicable, issuing a Final Order of
Liquidation
- Liquidating the insurer’s assets and
using this to fund insurer’s obligations
- Collecting assessments to fund any
shortfall
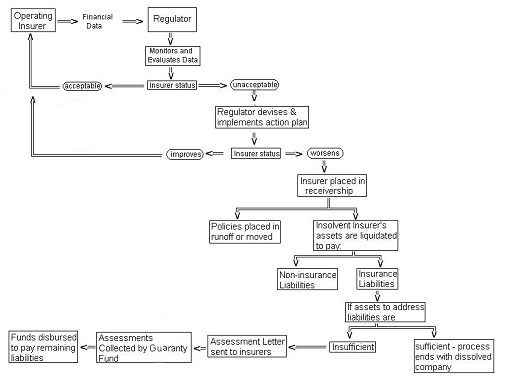
Here is how a
situation may appear:
|
|
Monitoring
Tools
As already mentioned,
state regulators receive insurer financial statements each year. These
statements are routinely evaluated against a set of tests. One test standard is
the Insurance Regulatory Information System (IRIS) ratios. It consists of 11
(P&C insurers) or 12 (Life insurers) ratios that can be calculated using
any insurer’s financial statement data. The ratio results can be compared to
established benchmarks that may indicate financial problems. The ratios are:
IRIS Ratios |
|
|
Ratio |
Explanation |
|
Net Premiums Written/Policyholders Surplus |
Annual Net Premiums divided by that insurer’s policyholder surplus.
Typically, a flag is raised when ratio exceeds 3.00. |
|
Change in Net Premiums Written (NPW) |
The change in NP written in the latest year divided by the annual net
premium amount from the previous year. |
|
Surplus Aid/Policyholders Surplus |
(Ceded Reinsurance Commissions divided by Ceded Reinsurance Premiums)
x Unearned Prem. For reinsurance ceded to non-affiliated companies |
|
Two-Year Operating Ratio |
Sum of loss ratio and expense ratio, less the net investment ratio
measured over two years |
|
Investment Yield |
Annual Net Investment Income multiplied by two, divided by the annual
average of cash and invested assets. |
|
Percent Change in Policyholders Surplus |
The change, expressed as a percentage, between an insurer’s current
and previous year’s surplus |
|
Liabilities/Liquid Assets |
Total Net Liabilities divided by Total Net Liquid (cash and near cash)
assets |
|
Agents’ Balances/Policyholders Surplus |
Balance owed by agents (being collected) divided by policyholder
surplus |
|
One-Year Reserve Development/Policyholders
Surplus |
Outstanding Incurred Loss Estimate (minus current year info.) divided
by policyholder surplus |
|
Two-Year Reserve Development/Policyholders
Surplus |
Outstanding Incurred Loss Estimate (minus last two years’ info.)
divided by policyholder surplus |
|
Current Estimated Reserve
Deficiency/Policyholders Surplus |
Current reserve estimate minus actual reserves reported |
|
Gross Premiums Written/Policyholders
Surplus |
Total of Written premium from business that is written directly as
well as from reinsurance issued by affiliates and non-affiliates. |
Generally, failure
to meet benchmarks of four or more ratios is an indicator that the applicable
insurer may be having financial problems. Corrective action then takes place,
such as more frequently reporting and evaluating subsequent financial data
and/or insurance audits.
Related Article: Monitoring Insolvencies – Risk Based Capital